(This is a draft and truncated version - for final and full version, see
Concise Encyclopedia of Biostatistics for Medical Professionals)
bivariate Gaussian distribution
A bivariate Gaussian distribution, better known as bivariate normal distribution, is a special type of bivariate distribution which follows a bell type shape (Figure B.7a). This figure has 3 axes. In the context of systolic and diastolic BP example in Table B.4 (but with ungrouped data), the bottom two axes depict systolic (x) and diastolic levels (y) and the vertical axis depicts number of subjects. Note the symmetry of this shape and equal standard deviations of x and y in Figure B.7a. In this case, you will see same shape no matter which side the plot is viewed from. The frequency is highest (peak of the distribution) when x and y values are at the middle of their ranges and the decline of frequencies on either side of these values follow the same pattern. The peak is such that kurtosis is zero. ... ...
For final and full version, see
Concise Encyclopedia of Biostatistics for Medical Professionals
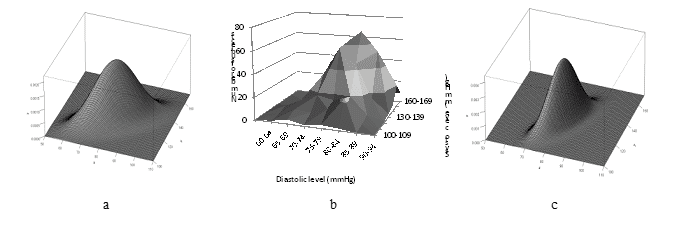
Figure B.7: (a) Bivariate Gaussian distribution with equal standard deviation of x and y; (a)Bivariate distribution of data in Table B.4; (c) Bivariate Gaussian distribution with unequal standard deviations
