(This is a draft and truncated version - for final and full version, see
Concise Encyclopedia of Biostatistics for Medical Professionals)
cusum chart
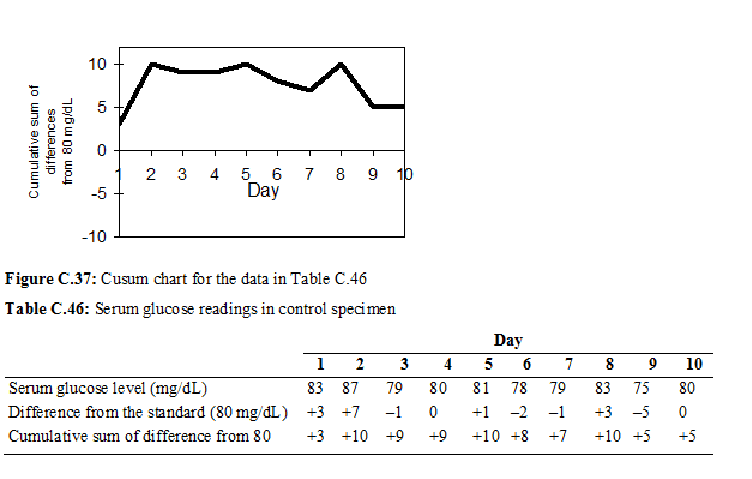
Cusum chart is a tool of quality control similar to control chart but this depicts the cumulative sum of the differences from the standard. For quality control in a medical laboratory, a control specimen with known standard value is analyzed each day and the difference from this known standard is plotted. Control chart is for detecting the outliers, which are considered beyond tolerance, and cusum chart is for plotting trend. Sometimes this plot reveals an increasing or decreasing trend indicating a need to revisit the functioning of the laboratory. Some subtleties of the daily change in the values are revealed much better by a cusum (cumulative sum) chart as in Figure C.37 for the data in Table C.46. This table gives differences of the values in control specimen from the known standard each day and the cumulative differences.
Even though no trend is discernible in this plot and no value is possibly outside control limits, all values are on the positive side of zero. This shows that there is some tendency to overestimate the value. Thus it is worthwhile to examine the laboratory procedures and functioning for possibility of a positive bias. This drift is more easily detected by a cusum chart than by the conventional control chart. ... ...
For final and full version, see
Concise Encyclopedia of Biostatistics for Medical Professionals
Concise Encyclopedia of Biostatistics for Medical Professionals)
cusum chart
Cusum chart is a tool of quality control similar to control chart but this depicts the cumulative sum of the differences from the standard. For quality control in a medical laboratory, a control specimen with known standard value is analyzed each day and the difference from this known standard is plotted. Control chart is for detecting the outliers, which are considered beyond tolerance, and cusum chart is for plotting trend. Sometimes this plot reveals an increasing or decreasing trend indicating a need to revisit the functioning of the laboratory. Some subtleties of the daily change in the values are revealed much better by a cusum (cumulative sum) chart as in Figure C.37 for the data in Table C.46. This table gives differences of the values in control specimen from the known standard each day and the cumulative differences.
Even though no trend is discernible in this plot and no value is possibly outside control limits, all values are on the positive side of zero. This shows that there is some tendency to overestimate the value. Thus it is worthwhile to examine the laboratory procedures and functioning for possibility of a positive bias. This drift is more easily detected by a cusum chart than by the conventional control chart. ... ...
For final and full version, see
Concise Encyclopedia of Biostatistics for Medical Professionals
